Virtual Threads: Fast, Furious, and Sometimes Stuck

At Games24x7, we handle an extremely high throughput during peak fantasy seasons. Most of our user-path services are built in Java, and to maximize CPU utilization at scale, we rely on reactive frameworks for efficient resource management. However, writing reactive code requires specialized expertise, a sit follows a fully asynchronous programming model, unlike traditional Java.
With the introduction of virtual threads in Java 19 (as a preview feature) and their full release in Java 21, we adopted Java 21 for all new services to leverage the benefits of virtual threads.
In this blog, you’ll gain a practical understanding of Java 21’s virtual threads and how they behave in real-world, high-throughput systems. We’ll walk you through a production issue we faced — where our service became unresponsive due to thread pinning caused by synchronized blocks — and how we investigated, reproduced, and ultimately resolved it.
By the end of this blog, you’ll learn:
- ⚙️How virtual threads differ from platform threads, and why they’re game-changing for I/O-heavy applications
- 🧵 What thread pinning is, why it happens with synchronized blocks, and how it affects virtual thread performance
- 🔄How Reentrant Lock helps avoid thread pinning, and when to prefer it over synchronized in a virtual thread context
- 🔍 How to debug virtual thread issues using Java Flight Recorder and thread dumps
- 🧪How to reproduce and simulate thread pinning issues to validate assumptions before making architectural changes
- 🚫 Common pitfalls when migrating to virtual threads, and how to avoid them in production
- ✅Actionable best practices for safely adopting virtual threads in high-concurrency environments
Let’s get going -
What Are Virtual Threads?
Virtual threads are lightweight threads managed and scheduled entirely by the JVM. Unlike traditional Java threads, which have a 1:1 mapping to OS threads and rely on the operating system for scheduling, virtual threads are decoupled from OS threads, allowing the JVM to efficiently manage them.
This design enables optimized thread scheduling, significantly improving resource utilization and allowing thousands or even millions of virtual threads to run concurrently with minimal overhead.
How Virtual Threads Enhance Performance and Scalability
Virtual threads are mounted on traditional platform threads (carrier threads). They are designed to yield control to the scheduler when they encounter blocking operations, such as I/O waits. When a virtual thread blocks, the JVM unmounts it from its carrier thread, freeing up the carrier thread to handle other tasks. This efficient scheduling mechanism ensures better resource utilization and scalability.
While virtual threads offer significant performance benefits, they have certain caveats. We encountered one such challenge in our production systems, which we will explore in the following sections, along with our investigation and resolution.
Facing the Unexpected
The service runs on Java 21 with virtual threads enabled, utilizing 4 CPUs and 12GBof memory per pod.
In our fantasy app, a match refers to a real-world cricket (or other sport) game in which users participate by creating fantasy teams. During peak match times—especially around the match start—we observe a traffic surge from2,000 RPS to around 10,000–13,000 RPS for this service. This increase, nearly5x, can occur within just 2–3 minutes, and in some cases, within as little as30–45 seconds. The elevated traffic persists as users engage with live features and real-time updates.
Although the service was designed to handle such load, we observed that some pods became unresponsive during these spikes, failing to serve requests—including health checks and Prometheus metrics APIs. Eventually, these pods were restarted after three consecutive health check failures, in accordance with the liveness probe configuration.
With no working endpoints during this period, we had no visibility into what was happening, making the issue even more challenging to diagnose.
Tracking the Culprit
We were able to reproduce the issue in our load-testing environment using a similar load pattern and identified one API that was experiencing high latency.
This API fetched data from a local cache(LoadingCache from the Caffeine library) while also executing its business logic. At this point, our investigation focused on the loading cache.
Below is the configuration of our LoadingCache:
LoadingCache<Long, Set<Long>> idVsCtSetLoadingCache;
private void initLoadingCache(){
   idVsCtSetLoadingCache = Caffeine.newBuilder()
           .expireAfterWrite(30,TimeUnit.SECONDS) // expire strategy
           .maximumSize(100)
           .build( id ->{
               try {
                   return makeAnIO(id); // Rest call to another service
               } catch (Exception e) {
                   LOGGER.error("Exception in initLoadingCache loader", e);
                   throw e;
               }
           });
}
Since we were performing I/O operations, we suspected that latency in I/O was causing requests to time out. To test this hypothesis, we modified the cache expiration strategy to RefreshAfterWrite.
To our surprise, the initial requests still failed, but once the cache was populated, the issue disappeared. This was our first breakthrough—LoadingCache was the culprit. But what made it so special?
What’s Special -
As we dug deeper into virtual threads, we discovered a crucial detail—they can cause thread pinning when a synchronized block is used. We will explore thread pinning in more detail later, but this finding was a turning point in our investigation.
Although we weren’t explicitly using synchronized in our application code, we suspected LoadingCache.A closer look at how LoadingCache's get() method works revealed that it relies on synchronized blocks in multiple places—especially when the cache is empty, being populated, or when an entry expires (with expireAfterWrite configured).
Below is the relevant code inside LoadingCache.get(), which internally calls ConcurrentHashMap’s compute()function::
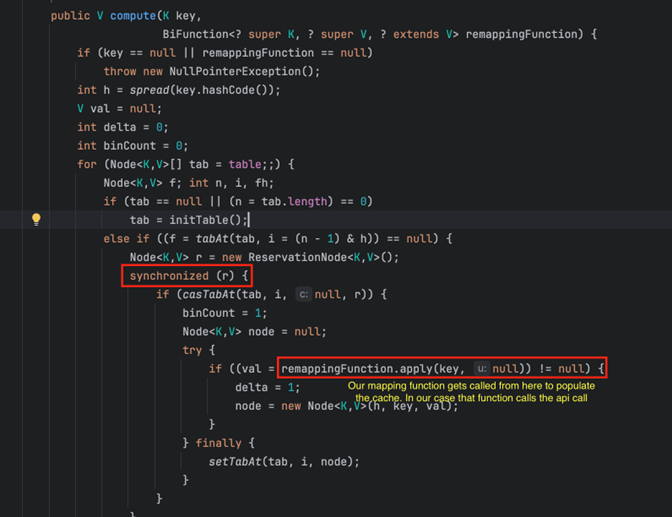
With this, we were confident that thread pinning was our issue, and we needed to validate it with a simple test.
As mentioned earlier, virtual threads are designed to be unmounted from platform threads when they encounter blocking I/O, allowing the platform thread to continue handling other tasks. However, if a virtual thread is blocked inside a synchronized block, it gets pinned, preventing the JVM from efficiently scheduling other virtual threads. This was precisely the issue we encountered.
Understanding Thread Pinning
Thread pinning in Java Virtual Threads occurs when a virtual thread is bound to a platform thread for an extended period, preventing the JVM from efficiently scheduling other virtual threads.
However, problems arise when a virtual thread encounters a blocking operation that does not yield control back to the JVM, such as:
- Native synchronization mechanisms like synchronized blocks.
- Blocking I/O operations such as Synchronous File I/Os, JDBC calls and socket I/Os.
When this happens, the virtual thread gets pinned to the underlying platform thread. Since the platform thread is now occupied, the JVM cannot reuse it to execute other virtual threads, limiting the benefits of virtual threading.
But One Pinned Thread Shouldn't Be a Big Deal, Right?
At first, this raised a question for us: even if one platform thread is pinned, shouldn’t the other platform threads still handle the load? After all, a few pinned threads shouldn’t bring the entire system down.
This made us dig deeper into what was happening under the hood during thread pinning and why this issue doesn’t occur in traditional Java applications using OS threads.
In the next sections, we’ll uncover the real reason why our service became unresponsive and how virtual threads behave in such scenarios. Stay with us!
Simulating the issue
The first step in our investigation was to reproduce the issue in a controlled local environment using a simple Spring Boot application.
We designed an application with two API endpoints:
1️⃣ Business Logic API – This endpoint simulates real-world processing by executing some business logic and then sleeping for 20 seconds inside a synchronized block.
2️⃣ Health Check API – A lightweight endpoint that simply returns 200 OK, mimicking real health checks used in production.
By running this setup under load, we aimed to observe how virtual threads behave when blocked inside a synchronized block, helping us confirm our suspicions about thread pinning.
Application.yaml settings for enabling virtual threads
spring:
 application:
   name: caffiene-load
 threads:
   virtual:
     enabled: "true"
BusinessLogic API-
public List<UserDetails> getUsersForMatch(long matchId) throws ExecutionException, InterruptedException {
   List<UserDetails> userList = new ArrayList<>();
   synchronized (LOCK){
       for(long i=0; i< 100; i++){
           UserDetails userDetails = new UserDetails(i, "user"+matchId, "shell");
           userList.add(userDetails);
       }
       Thread.sleep(20000);
   }
   return userList;
}
Health Check API -
public ResponseEntity<?> health() {
   try {
       Thread.sleep(3000);// 3s sleep to track the thread in JFR for longer duration.
   } catch (InterruptedException e) {
       throw new RuntimeException(e);
   }
   return ResponseEntity.ok(Thread.currentThread().getName());
}
Dockerfile-
To get deeper insights into what washappening at the system level, we containerizedour test application by creating a Dockerimage.
Insidethe container, we installed:
strace – To trace system calls made bythe application.
procps – To monitor process and CPUusage in real time.
FROM openjdk:21-slim
EXPOSE 8080

RUN apt update && apt install procps -y
RUN apt install strace -y
ADD target/test-local-cache-load-1.0-SNAPSHOT.jar /home/tomcat/test-local-cache-load-1.0-SNAPSHOT.jar

ENTRYPOINT ["bin/bash","-c"]
CMD ["java -jar /home/tomcat/test-local-cache-load-1.0-SNAPSHOT.jar"]
docker-compose.yaml to simulate a pod with restricted resources and take thread dumps and JFR (Java Flight Recorder) recordings.
version: '3.8'

services:
 app:
   image: caffiene-load:latest
   container_name: caffeine-load-test
   ports:
     - "8080:8080"
   environment:
     - JAVA_OPTS=-Xms2g -Xmx2g
   deploy:
     resources:
       limits:
         cpus: "2.0"
         memory: "3g"
       reservations:
         cpus: "2.0"
         memory: "3g"
   volumes:
     - /Users/ssg/ssg/thread-dumps:/home/tomcat/thread-dumps
To replicate the issue more closely, we restricted our test environment to 2 CPU cores and followed these steps:
- Started the application.
- Called the main API twice, manually hitting it sequentially with a 1-2 second interval.
- Called the health check API immediately after step 2.
Observation:
The health check API was blocked until the first API call completed (20 seconds) and the thread was freed. This meant that no other requests were processed during this period, including the health check!
This was a clear indication that our platform threads were getting pinned, preventing the JVM from scheduling other virtual threads.
Let’s break down why this happened!!
What Are My Threads Doing?
To get deeper insights into thread behavior, we started Java Flight Recorder (JFR)for 200 seconds inside the Docker container and re-ran our test scenario from the previous section.
You can use the following command to capture a JFR recording using jcmd:
jcmd <java pid> JFR.start name=myRec filename=<filepath>/<filename>.jfr duration=200sAfter 200 seconds, we ran the JDK mission control tool to analyse the JFR recording, and we found the following observations -
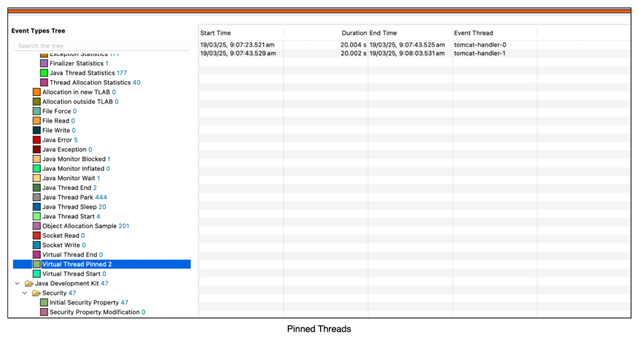
From our first JFR image, we identified the pinned threads. Let’s break down what we observed:
- The first thread (tomcat-handler-0) entered the synchronized block at 09:07:23 and slept for 20 seconds. It was freed only at 09:07:43.
- As soon as the first thread(tomcat-handler-0) exited the synchronized block, the second thread (tomcat-handler-1) acquired the lock and got pinned in the same manner.
At this point, we had two important questions:
- Why were there only 2 platform threads (ForkJoinPool) and not more?
- If both platform threads were getting pinned sequentially, why didn’t the waiting health check API execute on another thread?
Answering These Questions
1) Why Only 2 Platform Threads?
Since virtual threads are entirely managed by the JVM, the number of platform threads is determined based on available CPU cores.
- In our Docker container, we restricted CPUs to 2, so the JVM allocated only 2platform threads for the ForkJoinPool.
- This means only two virtual threads could be scheduled at any given time, making thread pinning a critical bottleneck in this case.
2) Why Didn’t the Health Check API Execute?
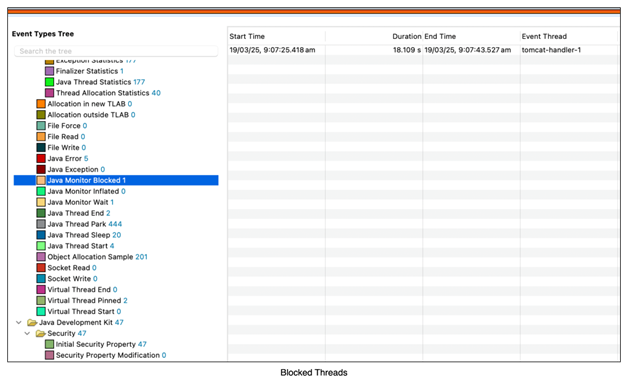
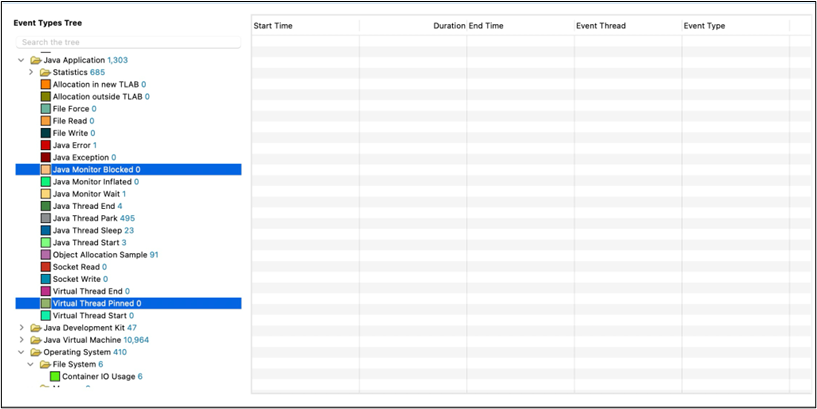
To answer this, let’s look at the second JFR image, which shows a blocked Java monitor (i.e., a blocked thread):
- The second thread (tomcat-handler-1) was waiting to acquire the lock on the synchronized block and was completely blocked.
- Because this thread was blocked, the JVM did not unmount the virtual thread from the platform thread.
- This meant that both available platform threads were pinned, leaving no free threads to execute the health check.
The result? A complete service freeze.
This was our End of the World moment—both platform threads were stuck, leading to service unresponsiveness.

If we run the same code with virtual threads disabled and provide tomcat max threads to be more than 2 then we can see that this issue doesn’t come because a new platform thread is created once the earlier 2 threads are blocked on synchronized block(1st inside the block and 2nd waiting for the lock). The health check request is executed on a 3rd thread. Here also, if we limit the Tomcat max threads to 2, then we can also see a similar issue that the health check API is not executed, as both the threads are blocked on a synchronized block.
Let's dive deeper into the second point to understand why the thread waiting on the synchronized block remains blocked
Demystifying The World of Virtual Threads
Based on our discussion, we’ve pinpointed the issue to the synchronized block—specifically, how the platform thread behaves once it enters the block and how the virtual threads waiting for the lock are affected.
As per Java documentation -
when a virtual thread is inside a synchronized instance method and invokesObject.wait() on the object, the virtual thread blocks in the JVM until awakened with Object.notify() and the carrier re-acquires the monitor. The virtual thread is pinned. It is executing inside a synchronized method, and further pinned because its carrier is blocked in the JVM.
This meant that both our platform threads from the previous discussion were completely occupied. Our curiosity kicked in, and we couldn’t resist diving deeper. So, we set out to prove it ourselves—let’s uncover what’s happening at the OS level
What Is Happening At The OS Level?
We now understand that when platform threads are blocked, the JVM cannot process new requests or perform other tasks using the fork-join pool until those threads are released. Since each platform thread is mapped 1:1 to an OS thread, this also implies that the corresponding OS thread is blocked as well.
To validate this hypothesis, we decided to trace all futex (fast user-space mutex) syscalls at the OS level using strace. To capture futex activity, we ran the following commands
nohup strace -f -tt -p <Java Pid> -e futex > strace.out 2>&1 &
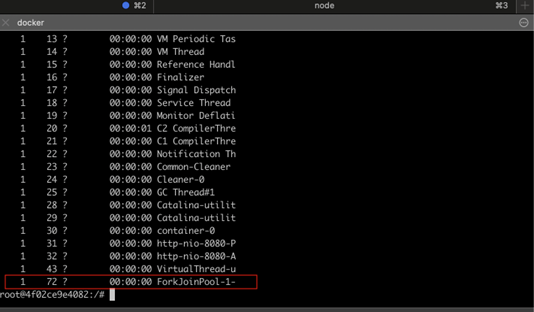
ps -T -p <Java Pid>
The first command traces all futex syscalls made by the Java application at the OS level. The second command helps identify the PIDs of fork-join pool threads—these threads are created only when an API is hit or a task is running on them. So, to capture the correct data, we first hit the APIs and then ran the second command to get the PIDs
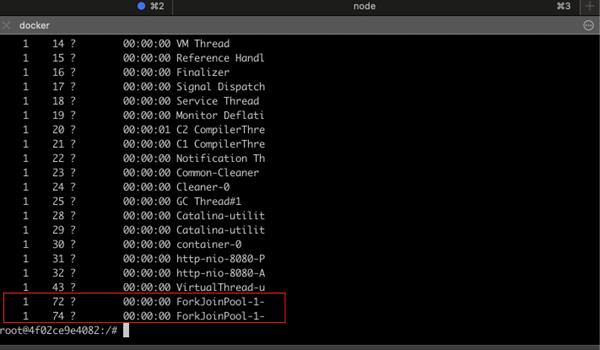
In our case, after hitting two APIs followed by the health check API, we checked the fork-join pool PIDs using the second command. We observed that both fork-join pool threads were created. Next, we filtered the futex traces specifically for these threads, and here’s what we found.
Thread with the first request

This is the 1st thread that takes the lock and sleeps for 20 seconds in the synchronized block
Thread with the 2nd request
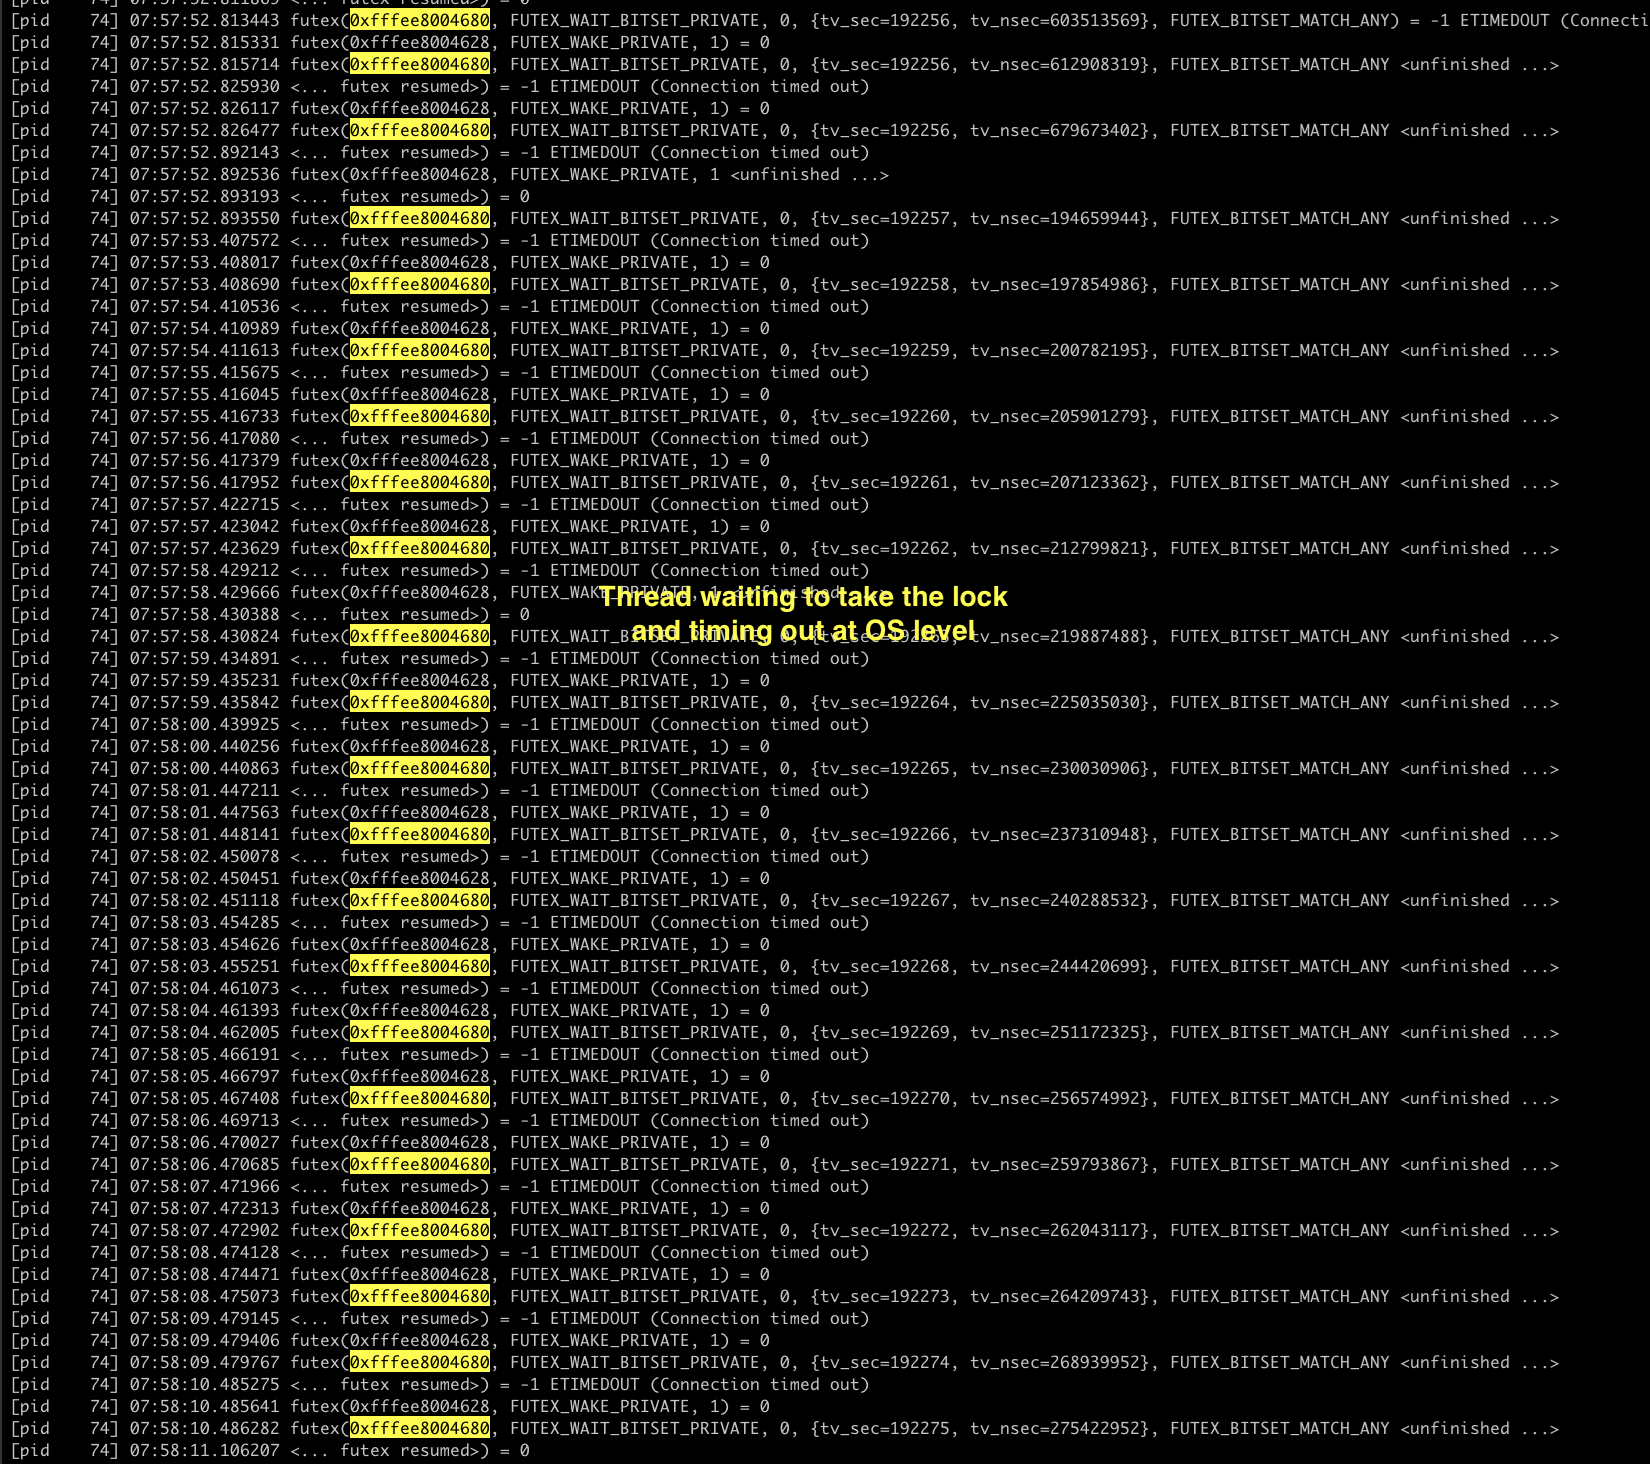
The above image shows the other thread, which tries to take the lock, and that goes on for 20 seconds, and every request is timing out as the lock is not available. This is all happening at the OS level, which shows that the control is now with the OS.
The Saviour - Reentrant Lock

So far, we've discussed how the synchronized block leads to thread pinning, causing waiting threads to be blocked. To avoid this, Java documentation suggests using ReentrantLock instead.
Naturally ,we wanted to test this ourselves. We modified our previous method, replacing the synchronized block with ReentrantLock. Below is the updated method
private ReentrantLock reLock = new ReentrantLock();
public List<UserDetails> getUsersForMatch(long matchId) throws Exception {
   List<UserDetails> userList = new ArrayList<>();
   try{
       reLock.lock();
       for(long i=0; i < 100; i++){
           UserDetails userDetails = new UserDetails(i, "user"+matchId, "shell");
           userList.add(userDetails);
       }
       Thread.sleep(20000);
   } finally {
       reLock.unlock();
   }
   return userSet;
}
After replacing the synchronized block with ReentrantLock, we repeated the same sequence of steps and generated a new JFR (Java Flight Recorder) file. Here's what we found
- Health Check API Execution:
- Unlike before, the health check API was executed immediately and was not blocked.
- Initially, we assumed that the first thread might still be blocked inside the lock, but the waiting thread was free and handled the health check request.
- Fork-Join Pool Behavior:
- We triggered the Business logic API twice sequentially, meaning one request was inside the lock, and the second request was waiting.
- Immediately after, we checked the fork-join pool PIDs using: ps -T -p <Java Pid>
- To our surprise, only one active thread was created!
- The second thread was not even spawned in the fork-join pool.
This was an unexpected but crucial finding. Instead of pinning and blocking additional threads, ReentrantLock prevented unnecessary thread creation, ensuring efficient thread management. But why did this happen? Let’s dive deeper.
Let’s break down the last observation -
- First API Call Execution:
- A platform thread from the fork-join pool is assigned to a virtual thread.
- The virtual thread enters the ReentrantLock and sleeps for 20 seconds.
- Second API Call Execution:
- When the second request arrives, the same platform thread is reused.
- This happens because the virtual thread inside the ReentrantLock(reLock) gets unmounted, freeing the platform thread.
- The new request gets assigned to a new virtual thread, which runs on the same freed platform thread.
- Health Check API Execution:
- When we hit the health check API, the same freed platform thread is used to process the request because, unlike the synchronized block, where a waiting thread remains blocked, here the waiting virtual thread unmounts, keeping the platform thread free for other tasks.
- Final State (After Sleep Completion):
- Once the first request's sleep completes, its virtual thread needs a platform thread to resume execution.
- Similarly, the second virtual thread, which was waiting for the lock, now acquires the lock and also needs a platform thread.
- At this point, two platform threads are required to complete both pending tasks.
- To verify this, we ran the ps -T -p <Java Pid> command as soon as the first request completed.
- We observed that two fork-join pool threads were now active, confirming that platform threads are efficiently reused rather than being blocked.
The above observations are exactly what is expected from a virtual thread’s behaviour to make the system more efficient and performant. Below is the image showing no pinning and no blocked threads in the JDK mission control tool for the JFR file -
So now the question arises, what's the difference between a synchronized block and a reentrant lock? Let’s understand -
Why Does Unmounting Happen in ReentrantLock
The major difference between a synchronized block and reentrant lock is that the in case of synchronized block the control is handed over to the OS by JVM using syscalls and JVM doesn’t have the complete control over that (also called the intrinsic lock), while in case of reentrant lock the lock is managed by the JVM completely.
So when a virtual thread is waiting for reentrant lock or blocked inside a reentrant lock the JVM allows it to unmount as JVM has all the control, while in case of synchronized block the lock is managed by the OS and since JVM doesn’t have the control over it it doesn’t allow the unmounting and the platform thread is stuck.
To better understand this, we can visualize the difference through animations. The black arrows represent the carrier threads, and the green ones are the virtual threads. This animation is for 2 CPUs with sequential calls to the application, as discussed earlier in the blog
Thread Flow With Synchronized Block
Here, we can see that both platform threads—one inside the synchronized block (pinned)and the other waiting for the lock (blocked)—are fully occupied. As a result, the system stalls, and no new requests are accepted since only two platform threads are available. This occurs because a synchronized block acquires a lock at the OS level, where the OS manages the lock instead of the JVM, leaving the JVM unable to intervene.
Thread Flow With Reentrant Lock
Here we can observe that when the virtual thread is blocked, the platform thread is unmounted and the same platform thread is reused for different requests. This happens because the reentrant lock is managed by the JVM, and the JVM has all the control over it
Key Takeaways
- Minimize the use of synchronized blocks when working with virtual threads. If synchronization is necessary, ensure that no I/O or blocking operations are performed inside the block.
- Prefer ReentrantLock over synchronized for better scalability and performance, as it allows the JVM to manage locks efficiently without causing thread pinning.
- Handle library-induced synchronization carefully. If a synchronized block comes from a library, such as Caffeine’s LoadingCache in our case, opt for its async variant to avoid blocking. If no async variant is available, consider switching to a library that is either lock-free or supports asynchronous execution.
- Here are some common library alternatives to avoid thread pinning and achieve better scalability:
- Switch from JDBC to R2DBC, which is completely non-blocking.
- If you are using Apache HttpClient or OkHttp, they can cause thread pinning; instead, switch to java.net.http.HttpClient, which is non-blocking internally.
- Use AsyncLoadingCache instead of LoadingCache, as it provides non-blocking behavior.
Conclusion
Virtual threads have revolutionized Java by enabling massive scalability, allowing thousands to millions of lightweight threads to run efficiently while reducing the overhead of traditional OS threads. We've successfully optimized multiple production applications using Java 21, but an unexpected load pattern combined with a simple synchronized block led to significant performance degradation.
This challenge provided invaluable insights into debugging and fine-tuning our application for virtual threads. Fortunately, Java 24 has addressed this issue for the synchronized block, making virtual threads even more robust and reliable for high-performance applications.
Resources -
- Virtual Threads - https://openjdk.org/jeps/425
- Synchronize Virtual Threads without Pinning - https://openjdk.org/jeps/491
About the Authors
Saurabh Singh is a senior backend engineer atGames24x7 with over 6 years of experience in software development. He specializes in building and optimizing high-scale distributed applications, focusing on enhancing performance while reducing costs.
Jatin Sinha is working as an SDE-2 at Games24x7and has around 4.5 years of experience. He likes problem-solving and enjoys building and maintaining distributed systems at scale.
Explore More
Discover the latest insights from the world of Games24x7


